
Grandes fraudes científicos de los siglos XX y XXI
Este podcast va dirigido a todas aquellas personas que buscan la verdad. A través de los episodios estaremos exponiendo, cómo la "mala ciencia" distorsiona la realidad, alejándola de la verdad, afectando todos los aspectos de la vida. Describiremos el origen y las herramientas de esta "mala ciencia" que son principalmente: la politización de las ciencias, la ciencia de los paradigmas y la teoría del consenso en las ciencias. Además, a lo largo de los episodios iremos discutiendo la relación de estas con una serie de anomalías sociales, y cómo afectan los cinco valores que en nuestro concepto son esenciales: las ciencias (como valor o concepto); el pensamiento conservador; el cristianismo y el judaísmo; la familia, y nuestra forma de producción.Como médico epidemiólogo y de salud pública, enfatizaremos en los aspectos de salud, pero también nos estaremos refiriendo a otros aspectos sociales, como los políticos y económicos, en cuanto a que estos son factores condicionantes del bienestar humano. Nuestras intervenciones persiguen destacar el derecho que tenemos los seres humanos a discutir nuestras ideas en un ambiente democrático, donde se de el libre flujo de las ideas, y en donde prevalezca el pensamiento reflexivo e inquisidor que nos permita acercarnos a la verdad. En este proceso de análisis, estaremos abordando las prácticas de salud que contribuyen al bienestar personal y social, como una manera de aplicar en nuestras vidas, la "buena ciencia" o, simplemente, la ciencia. Además, analizaremos aquellas prácticas, comportamientos y decisiones médicas, que aún cuando algunas provengan de instituciones "oficiales", estén revestidas de anomalías que perjudican nuestro bienestar.
Grandes fraudes científicos de los siglos XX y XXI
Conclusiones sobre el paradigma del cambio climático Ii.
Use Left/Right to seek, Home/End to jump to start or end. Hold shift to jump forward or backward.
Este es el episodio No 56 y el No. 28 de la segunda temporada de nuestro podcast GRANDES FRAUDES CIENTIFICOS.
El material presentado aquí es el producto de una investigación del tema que realicé durante 5 años y que tengo consignado en mi libro: Los dos grandes fraudes científicos de los siglos XX y XXI.
En este episodio inicio las conclusiones finales sobre el cambio climático.
El contenido central de lo presentado en este episodio se encuentra debidamente referenciado en mi libro. A continuación presento algunas citas adicionales.
Los días más calientes que ha tenido Florida en la historia no han sido en este año 2023
Sistema de medición del clima en la Florida
https://climatecenter.fsu.edu/
Gráfica del Dr. John Christy y su equipo
https://estebanmoralesvankwartel.com/wp-content/uploads/2022/05/grafica-del-Dr-John-Christy.png
Imágenes originales en donde se comparan las curvas de Hansen y col. (107 modelos) con la del Dr. John Christy.
https://estebanmoralesvankwartel.com/imagenes-originales-en-donde-se-comparan-las-curvas-de-hansen-y-col-107-modelos-con-la-del-dr-john-christy/
Lo presentado actualmente y lo que presentaré en el futuro, pueden encontrarlo de manera más detallada en mi libro: LOS DOS GRANDES FRAUDES CIENTIFICOS DE LOS SIGLOS XX y XXI. Este lo pueden adquirir como libro físico en todas las sucursales de la librería panameña EL HOMBRE DE LA MANCHA. Igualmente, puede ser adquirido como ebook haciendo clic en el enlaces anterior.
Los invito a suscribirse a mi sitio web donde podrán acceder a nuestro podcast y a mucha otra información de interés. Este lo pueden encontrar también en los directorios de Apple podcast; de spotify y todos los mayores directorios de podcasts.
Pueden enviar sus comentarios y observaciones a través de mi sitio web, así como a mi correo electrónico estebanmoralesvk@gmail.com
Presehtation and Iintroduction 0:00
While the beaches remain crowded in Florida, panic sellers continue to try to frighten the population. Thank God many people have already become aware of this Machiavellianism and many others are already beginning to strongly suspect it.
We are already in August, the third month of summer. At least, as far as Florida is concerned, this is the hottest month whose normal value, on average, is 86.64 degrees Fahrenheit according to the Florida Climatological Center. It is still too early to evaluate August, but the average in the 7 days that go, is around this value.
Hello, welcome to episode No. 56 of our podcast GREAT SCIENTIFIC FRAUDS, and No. 28f our second season.
I am your host Dr. Esteban Morales van Kwartel.
In the previous episode I started analyzing some temperature indicators and then I started discussing the validity and accuracy of climate models. Today I will conclude with this topic, but first, I will talk about some additional indicators. Always keep in mind that we are in a Niño/La Niña year, in which the Earth's temperature typically increases by mechanisms that I have already explained extensively in the previous episode and previously in others. This, as I mentioned, was reflected in the month of July.
Some other indicators. 01:41
The media continue with their dishonest and alarmist information about the weather. Many things have been said, but some of the things that have not been said are as follows.
For example, in Florida the hottest day reported was in June 1931. It was 109 °F (42.2 °C). Until this year no temperature higher than this has been reported. That was in Jefferson County in the city of Monticello. It must be taken into account that the temperature has been monitored in Florida only since the beginning of S.19 so that in history there may have been days and even hotter years, and even times, which as we know, occurred in the Middle Ages.
But this is not the end of it. 107 degrees have been reported in 2 counties in the years 1930 and 1993. In addition, temperatures of 108 degrees have been reported in different counties in the years 1897, 1909, 1944, 1985, 1988, 1992 and 2010. 1992 was the hottest day in Miami Dade. In no other year, including the current one, have these temperatures been exceeded.
But let's look at another indicator that shows once again the dishonesty and disrespect of the media. There is a fundamental difference between the indicator called the heat index and the temperature indicator. The second is what marks the thermometer and the first is how you feel or perceive the temperature. This has higher values because how it is perceived depends on several factors mainly the level of humidity in the environment.
Well, some media, expose in their reports the heat indexes, obviously in red, without clarifying that they are not the true temperature. This, of course, when you see figures of 100 Fahrenheit or more, scares people.
In the next episode I will discuss some other variables. Now I continue with the analysis of predictive climate models.
Analysis of predictive models 04:41
Remember that in the previous episode I said that the leaders of some climate organizations say in their terrifying jargon that the whole planet is a disaster and that this is totally consistent with repeated predictions and warnings." Well, his predictions have been consistently false as demonstrated by Dr. John Christy and as I continue to describe.
In addition to what Dr. Christy said, which we presented in the previous episode in his statement to the United States Congress, regarding the usefulness of CO2, he also referred to the great difficulty of predicting the climate, a reality that has been underestimated by those who have developed computer prediction models.
These models are based on the incorporation in computers of multiple equations with which they try to introduce numerous factors that can affect the climate, in an effort to predict future climate events. However, given the complexity of this, what is generated are hypotheses and not proven scientific facts as should be the way in which sciences work.
His approach was, then, that, if all the elements that make up the model are present and correct, this should be a good predictor; otherwise, the model is invalidated. This constituted the working hypothesis that Dr. used in his line of research with his colleagues and whose results he proceeded to present in his testimony.
The IPCC establishes a cause-and-effect link between increased CO2 emissions and climate impacts (the principle underlying the development of these models); this was what led the CEQ to incorporate this statement in the preparation of its standards. Remember that the CEQ is the council created by Obama, which initiated the whole policy of ending CO2 emissions; A gas, by the way, necessary for the sustenance of all life on the planet. This even led Dr. Christy to wonder if the proponents of this really understood how GHGs work.
Well, to test his working hypothesis, he and his team were monitoring the troposphere. This is the layer that goes from the year 1979 (until 2014). They monitored it from above, using satellites, and from below, using weather balloons; then, comparisons were made, between their observations (what actually happened) and the prediction models (102 models produced by the IPCC).
Conclusions and farewell 08:44
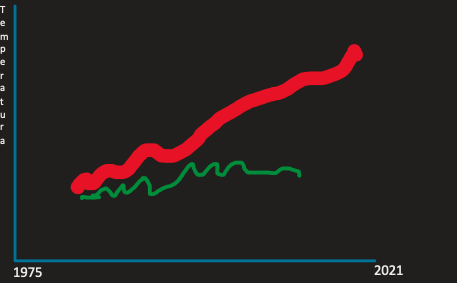
In the graph that I'm going to try to describe verbally, but that you can see in the description of the episode, for you to analyze it, you can see
At the top in red a thick line with a very steep slope upwards, indicating a warming that increases drastically.
This represents the data of Hansen and others, remember, were the ones who developed and presented the climate prediction model, and that summarizes a set of 102 prediction models all wrong and it is obvious that they are because below this line with this steep slope is, in green, with a slight slope, that of Christy and his collaborators that represents the measured temperatures, that is, what actually happened, which shows stable temperatures well below those calculated by computers. It even shows periods when there is a tendency to cool.
The conclusion was that their results showed clear evidence that the models provide misinformation about warming.
I will allow myself to read verbatim Dr. John Christy's conclusion on the prediction model.
... The models have a strong tendency to overheat the atmosphere relative to actual observations. On average, the models warm the global atmosphere at a rate three times that of the real world. Using the scientific method, we would conclude that the models do not accurately represent at least some of the important processes affecting climate because they could not "predict" what happened. In other words, these models failed the simple test of telling us what has already happened and therefore would not be in a position to give us a sure answer of "what" may happen in the future and "why". As such, these would be of highly questionable value in determining policies that should depend on a very secure understanding of how the climate system works.
Finally, as a consequence of his results, he answered the question elaborated earlier:
Greenhouse gas emissions cannot be used as a representation of supposed climate change because our ability to demonstrate how greenhouse gases influence the already observed climate is very poor.
However, despite the demonstration of the failure of the model, it has continued to be used to date.